
A day and Days around the world in the year of 2021
Followed by English translation.
本作品は、世界の一日を一枚の写真として俯瞰する A Dayと、一つの場所の1年間の様子を記録したDaysで構成している。写真は、YouTubeで公開されているライブ画像を使っている。
2020年から感染を広げたCOVID-19の影響が続く中で、自国ばかりではなく、他の国の感染状況も追いかけるようになった。報道される人々は、それぞれの地域で暮らしながら、それぞれの流儀でCOVID-19に向き合っている。この作業を通じて、遠い国々やそこに住む人々とは、COVID-19という厄介なもので繋がりながら、同じ時間を生きていることを強く感じるようになった。
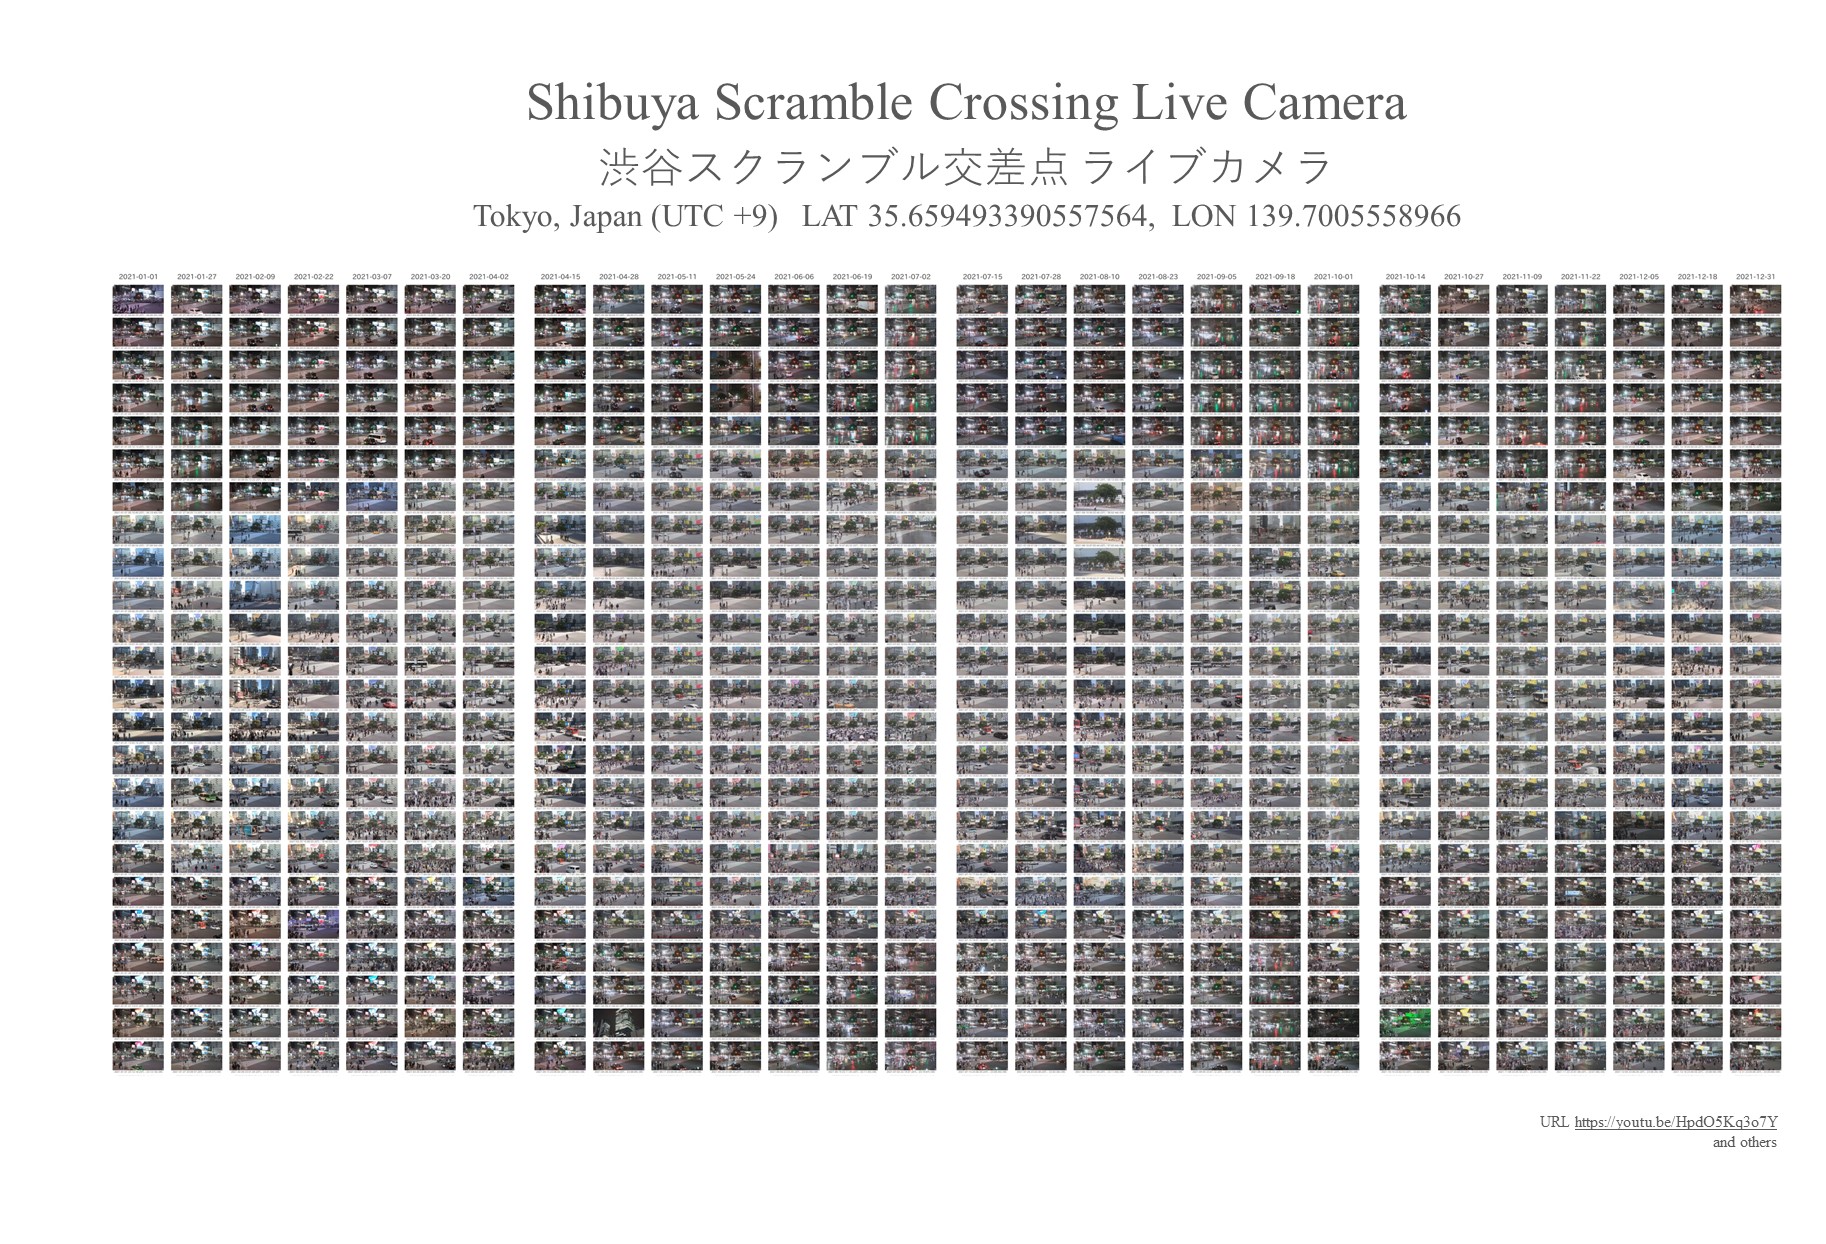
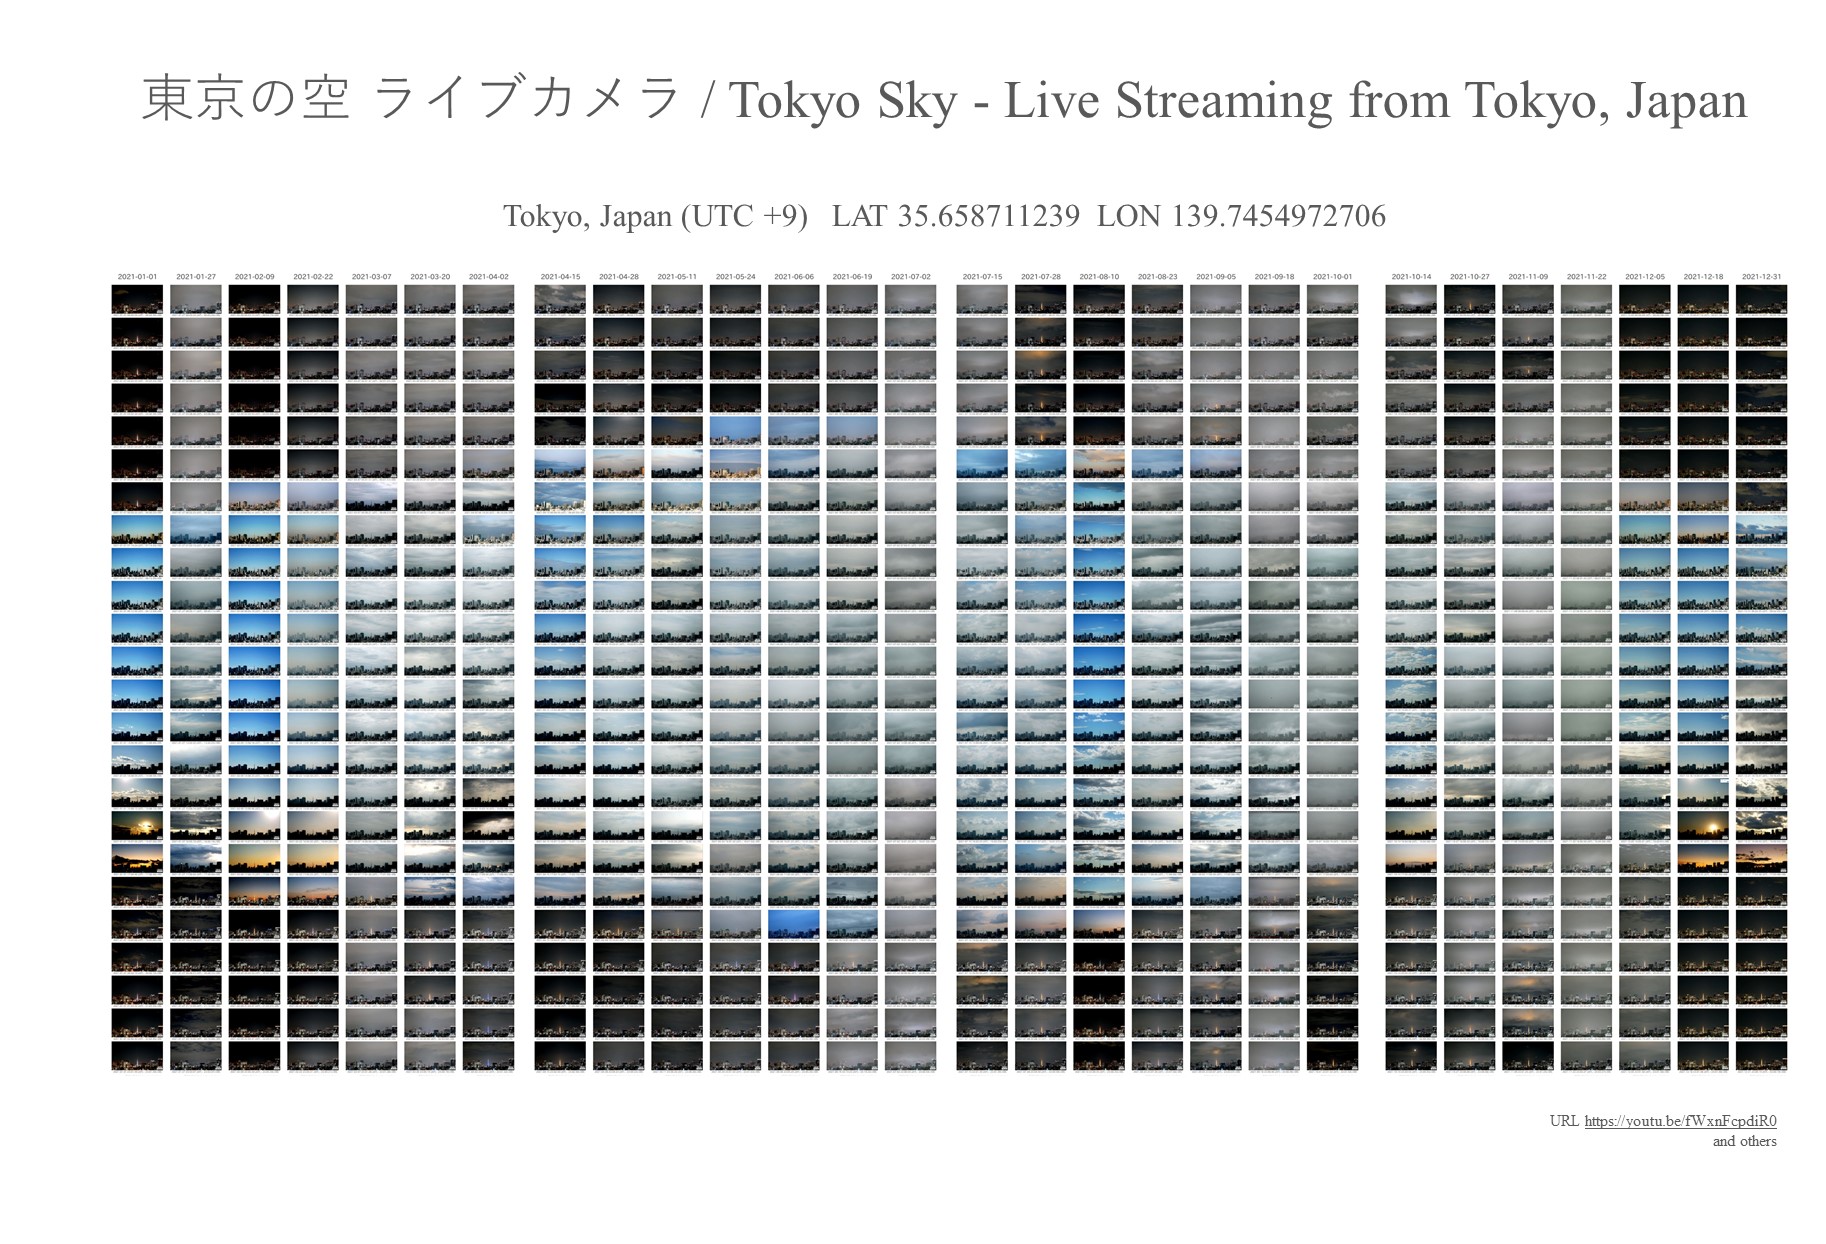
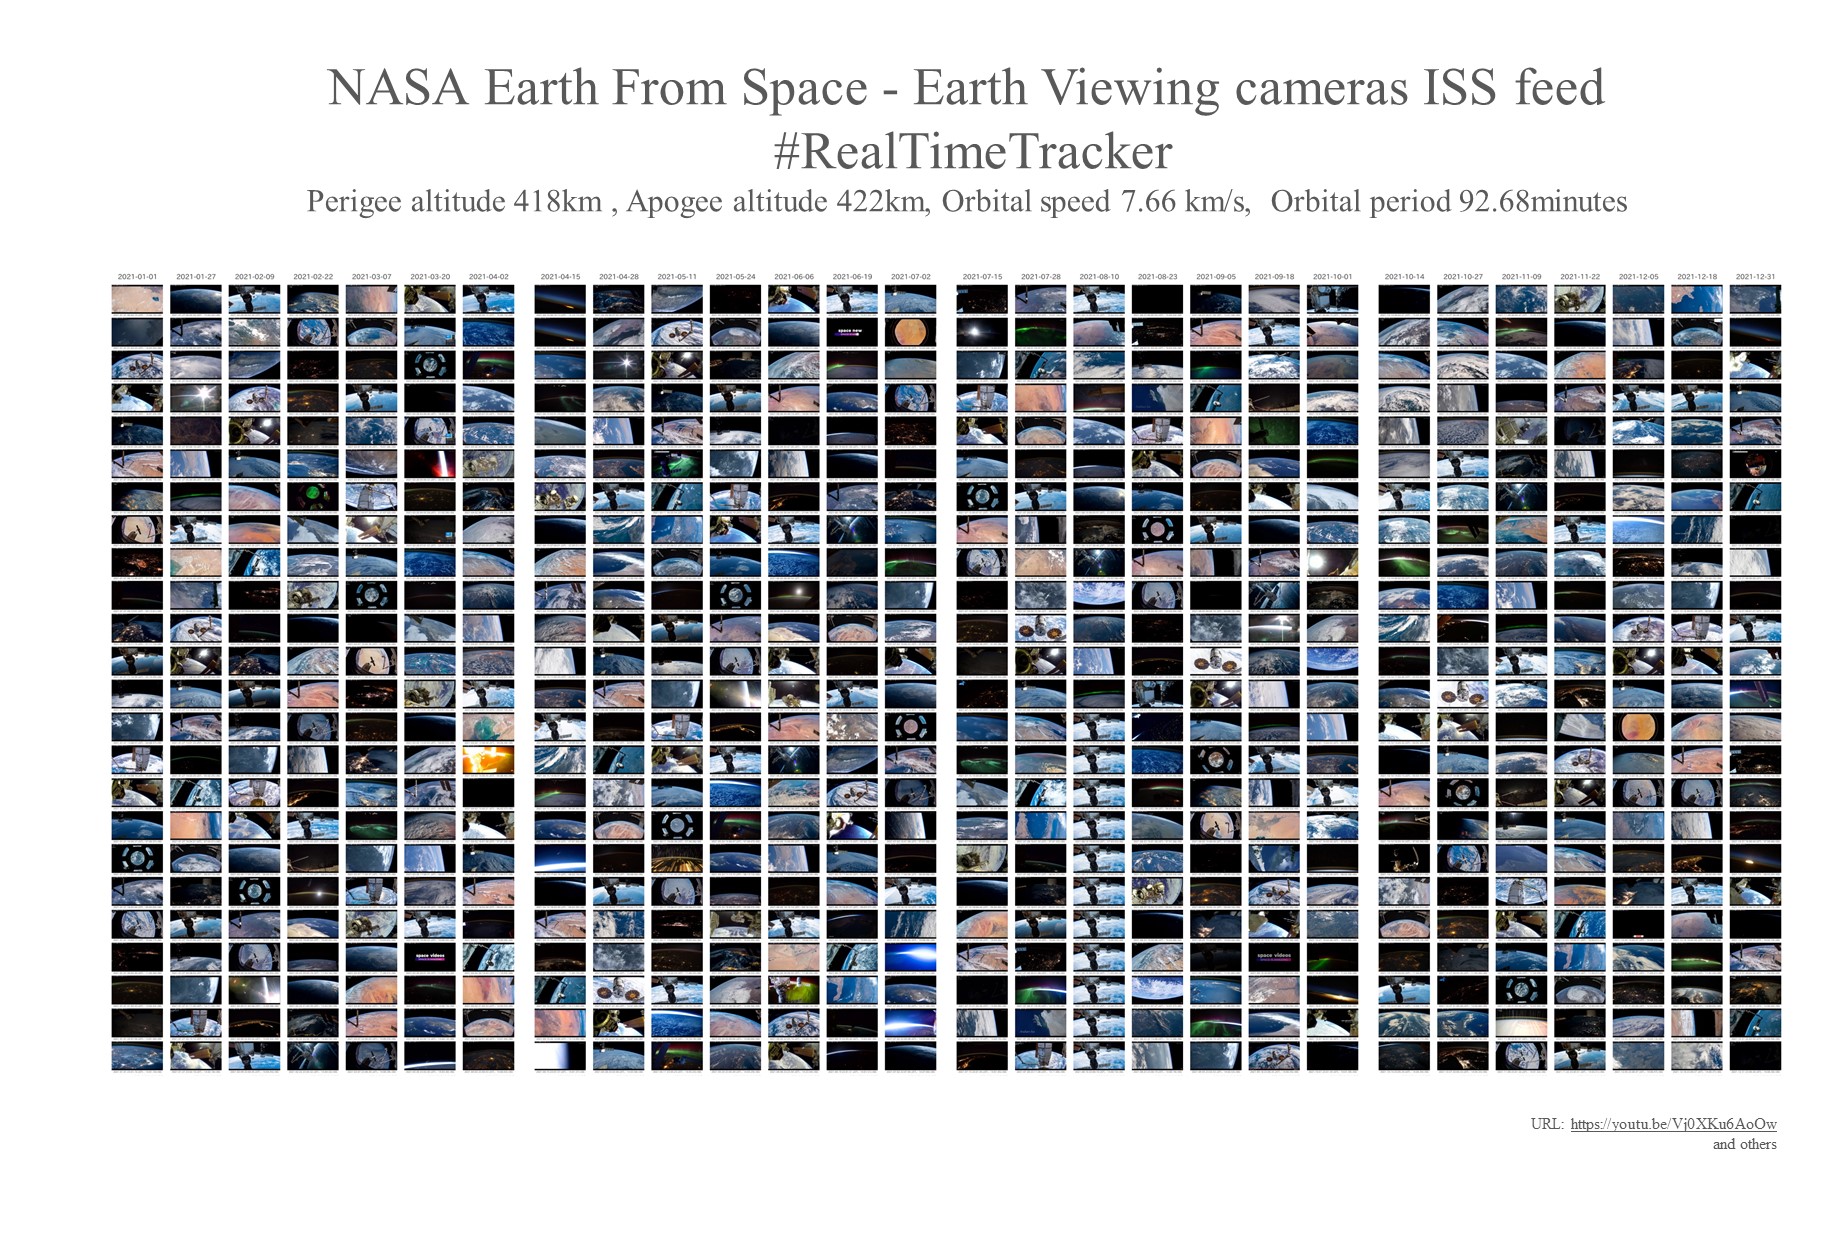
この様子を、視覚的に捉えるため、世界中の一日を俯瞰するために一日を24枚の写真で構成し、異なる地域の同じ一日を経度に沿って並べたA Dayの制作を行った。そして、同じ場所の一年間をまとめたものをDaysとして制作した。Daysは365日分の写真で構成しているが、本作品では365日を28日に分割し、1月1日に始まり12月31日に終わるように構成した。
写真は、YouTubeで公開されている世界各地のライブカメラの画像を記録したものを使っている。ライブカメラが止まることもあれば、画像を記録しているコンピュータが止まることもある。画像が記録できなかったスロットは、出来る限り近接する日時で補完し、補完出来ないものはそのままの画像を使っている。
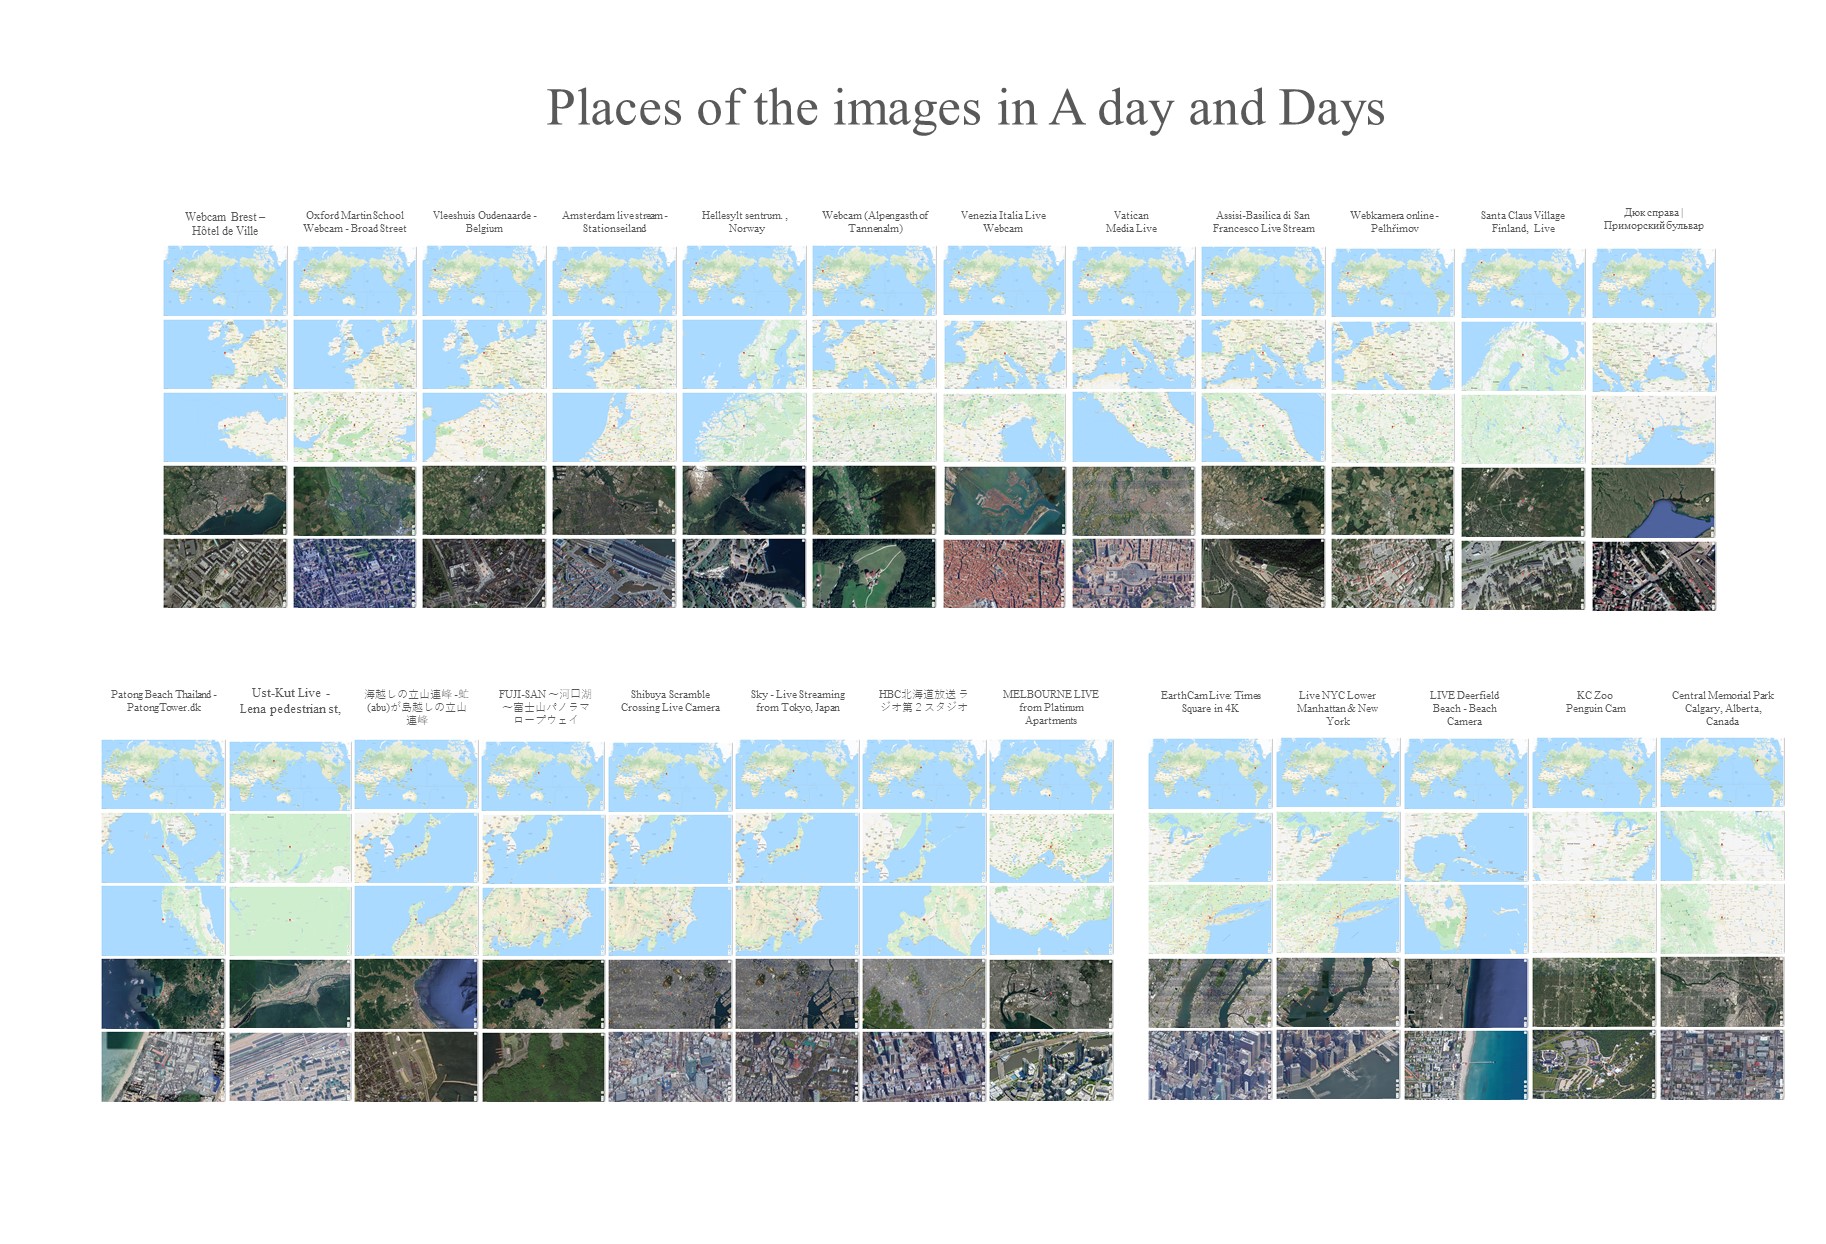
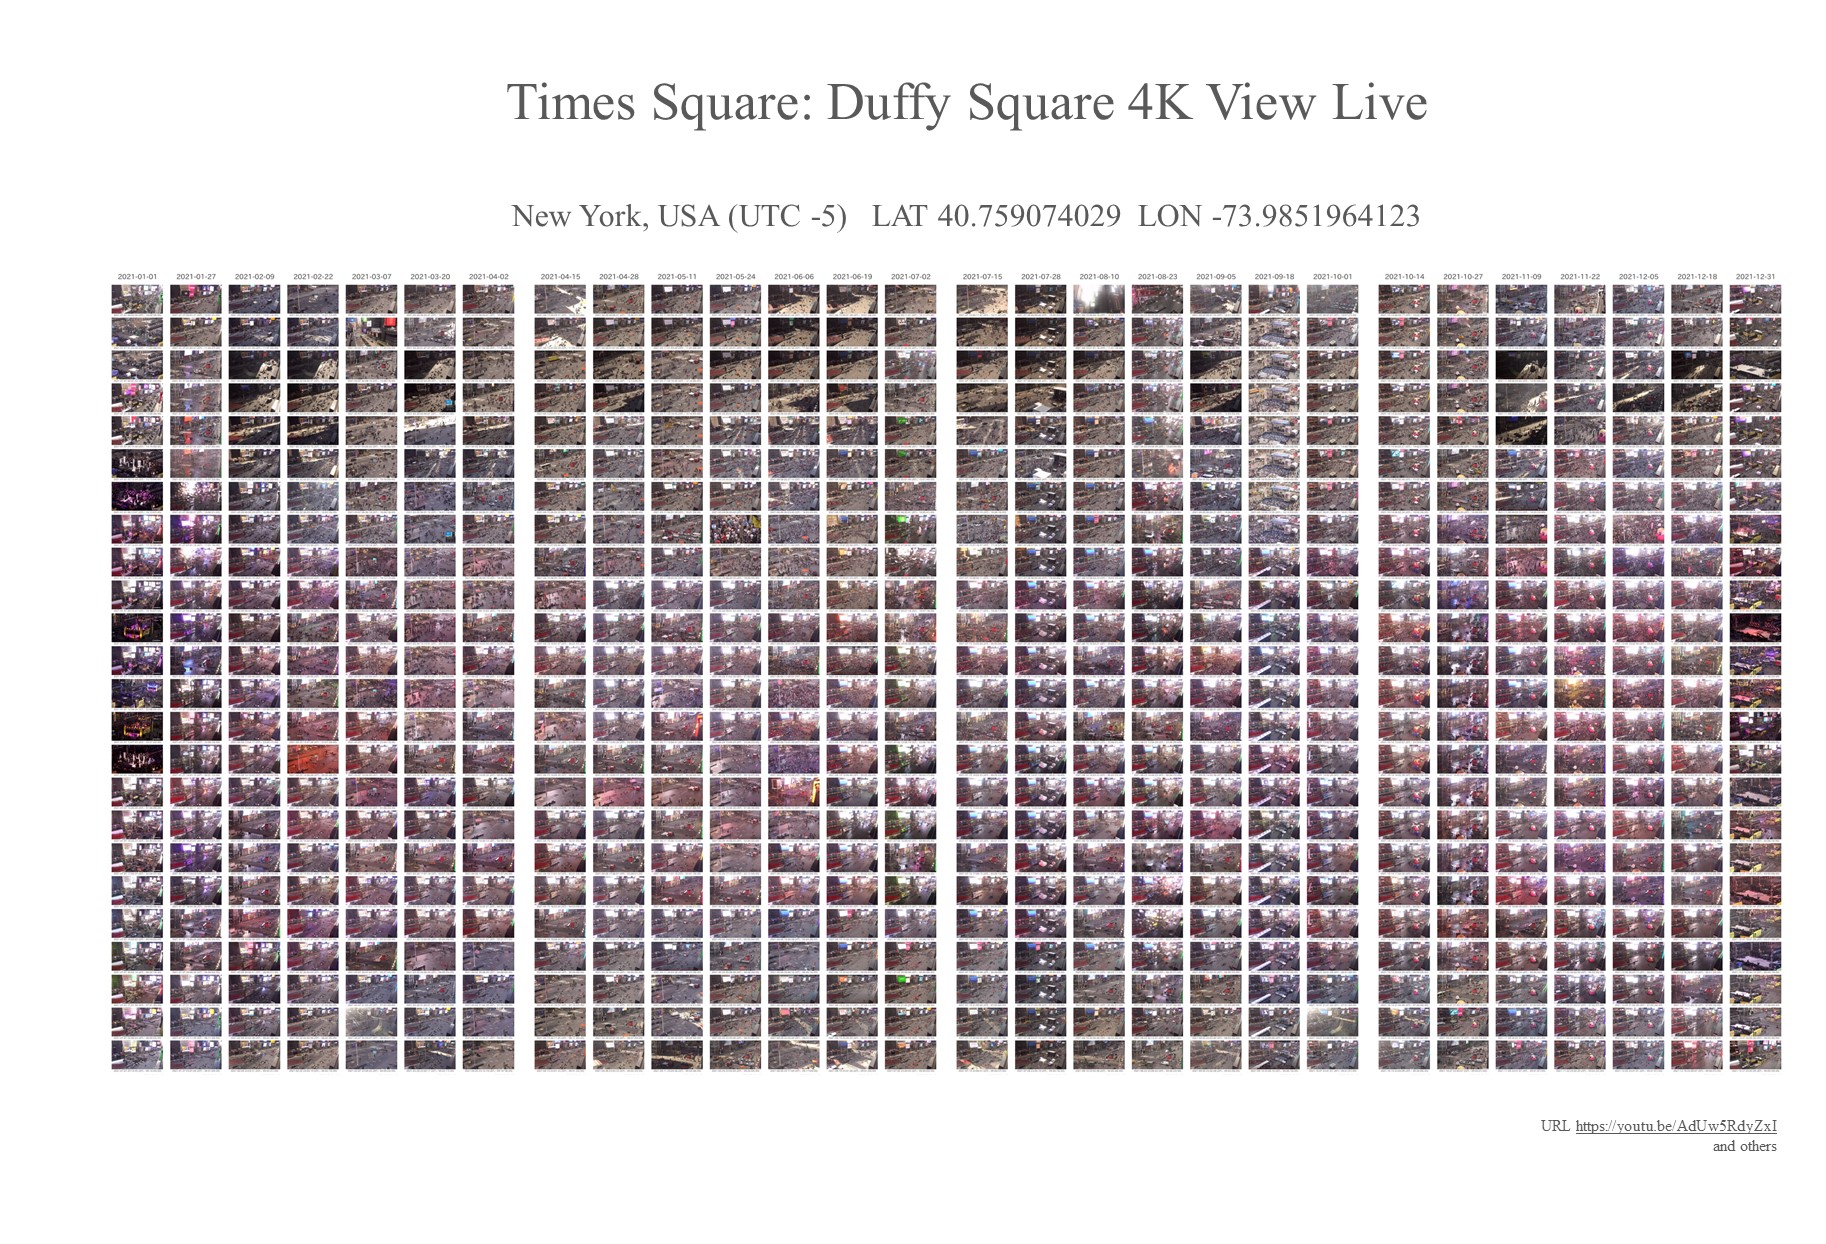
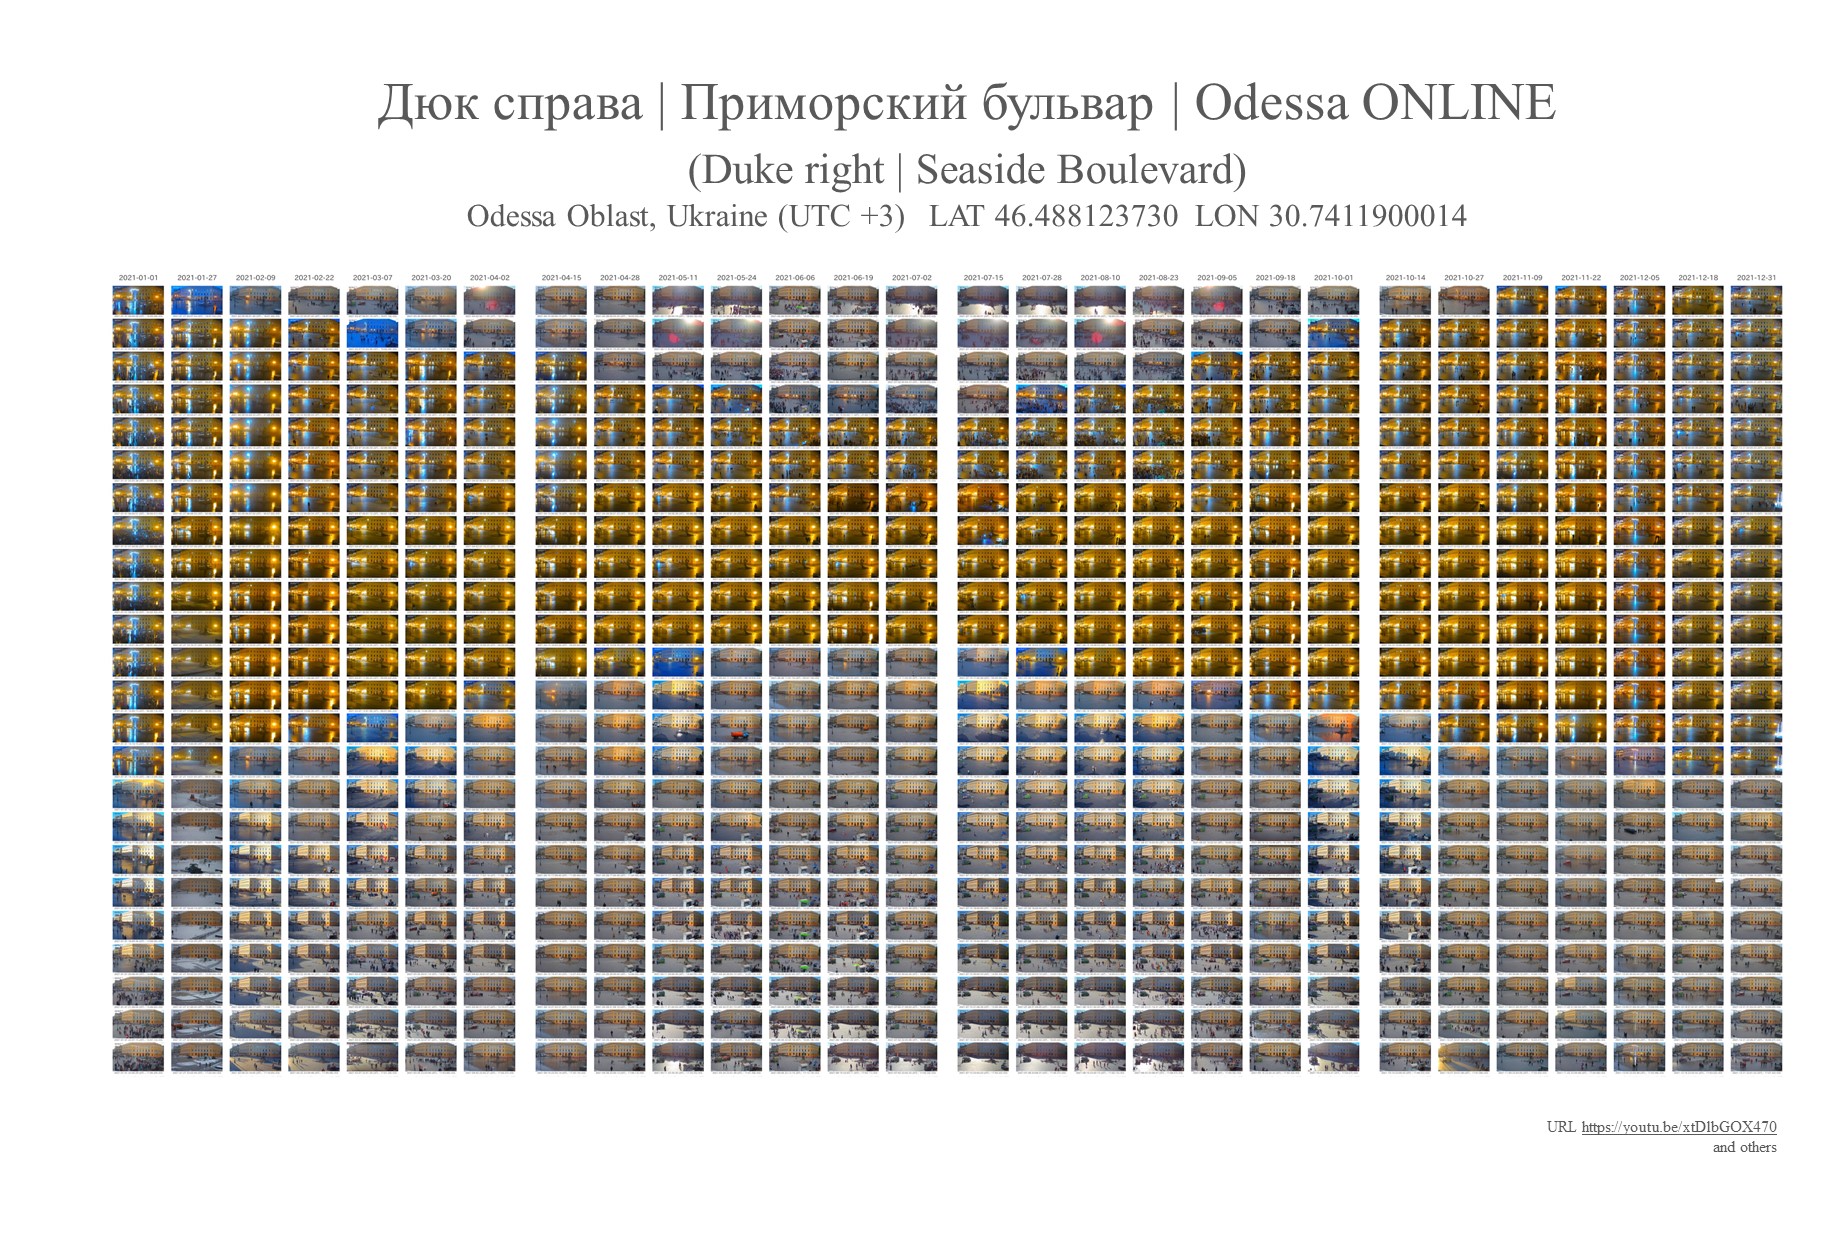
This work consists of A Day (cover), which is a bird‘s eye view of a day in each of the regions around the world facing COVID-19, and Days, which records changes in a single location over a year, with each day consisting of 24 photographs (24 hours).Days originally consisted of 365 days of images, but it was divided into 28 days to create a single image in this work. The photos were taken from live images available on YouTube.
Faced with COVID-19, which has been spreading since 2020, I began to closely follow the infection situation not only in my country (Japan) but also in other countries around the world. People are living in their own regions and facing COVID-19 in their own ways. And through this work, I have come to feel strongly that people around the world are living at the same time, connected to distant countries, and living with the troublesome COVID-19.
Aiming to capture this situation visually, I created A Day, which consists of 24 photos of a day around the world to give a bird’s eye view of the same day in different regions, arranged along longitude. And a year in the same place was summarized as Days. Days consisted of 365 days of photos, but in this work, 365 days were divided into 28 days, starting on January 1 and ending on December 31.
The photos are taken from live camera images from around the world available on YouTube. Sometimes the live cameras stop, and sometimes my computers are in trouble. Hours where the images could not be recorded were complemented with the nearest date and time as much as possible, and hours that could not be complemented were used as they were.
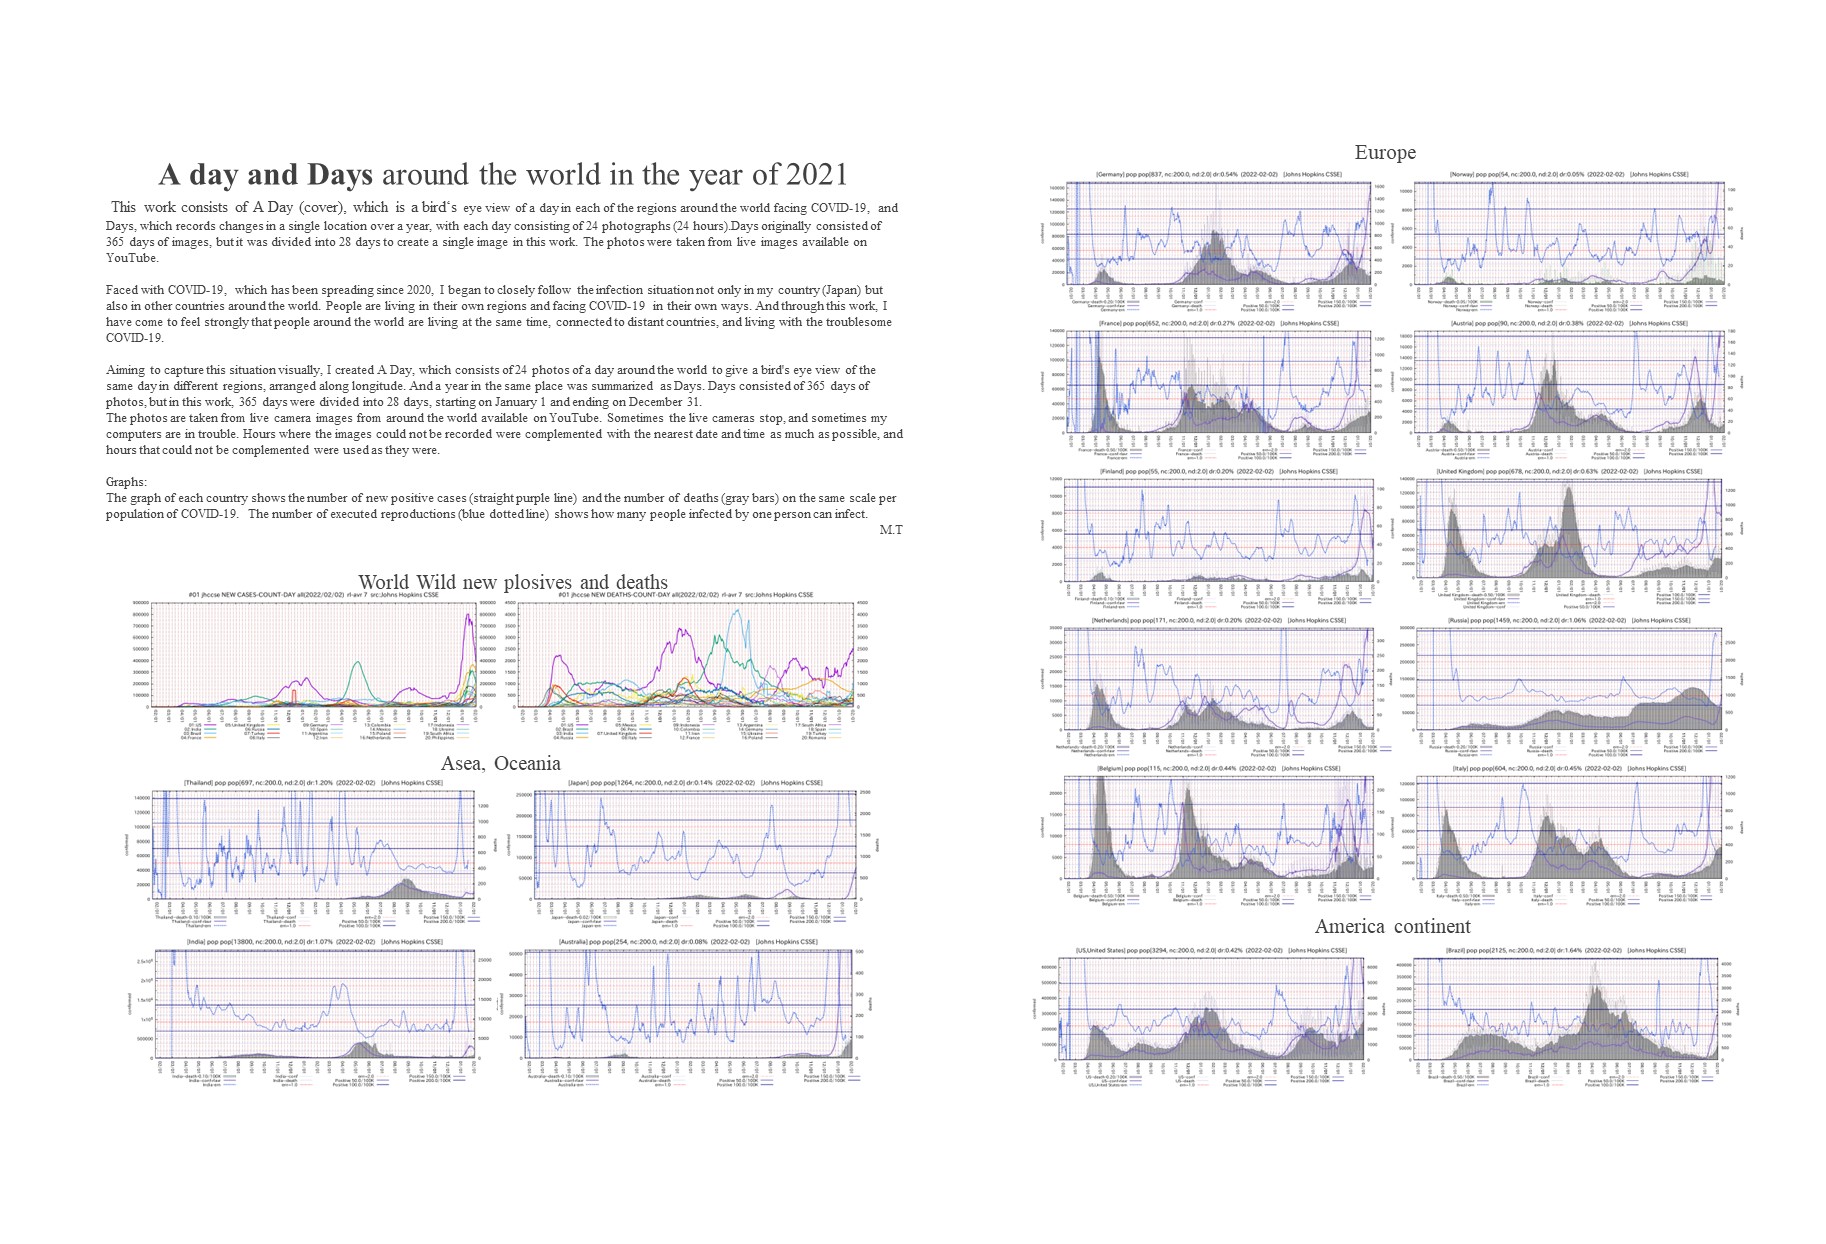
Graphs:
The graph of each country shows the number of new positive cases (straight purple line) and the number of deaths (gray bars) on the same scale per population of COVID-19. The number of executed reproductions (blue dotted line) shows how many people infected by one person can infect.
M.T


A day and Days around the world in the year of 2021 | International Photo Awards
A Day and Days Around In The Year of 2021 – Single Winner (budapestfotoawards.com)